Making the Leap to Clean Energy­—and Net Zero

Download Now

White Paper
Minute Read

Introduction

The collective urgency for addressing climate change continues to grow. In August, the U.N.’s Intergovernmental Panel on Climate Change (IPCC) published a landmark report making clear that limiting global warming to 1.5°C is still possible but requires immediate and rapid change.1  

At COP26, the U.N. Climate Change Conference in November, governments around the world will gather to try to make that change—by adopting plans to drastically reduce their greenhouse gas (GHG) emissions. 

A major part of those plans—and the transition opportunity—must address the energy sector, which is the source of 73% of total emissions.2 Because power needs are universal, it’s clear what the world needs to do: make the leap to clean energy. 

73% of global emissions come from the energy sector

Additionally, the electrification of industry and transportation is another huge driver of the net-zero transition—but only to the extent that clean forms of energy are used. As a result of this increased electrification, overall demand for electricity is rising. In fact, one study from the U.S. Department of Energy concluded that widespread electrification will increase 2050 U.S. electricity consumption by up to 38%.3

But while we know what the world needs to do, there isn’t much time to make this leap. According to the International Energy Agency (IEA), reaching net zero by 2050—the mid-century target of the Paris Agreement—hinges on an unprecedented clean energy push through 2030 (see Figure 1).4 By the end of this decade, we need to see a massive deployment of all available clean energy technologies, including renewables, electric vehicle charging stations, hydrogen, and carbon capture and storage.

Figure 1: Annual Clean Energy Investment in the IEA's Net-Zero Pathway

Annual Clean Energy Investment in the IEA's Net-Zero Pathway
Source: International Energy Agency (IEA).

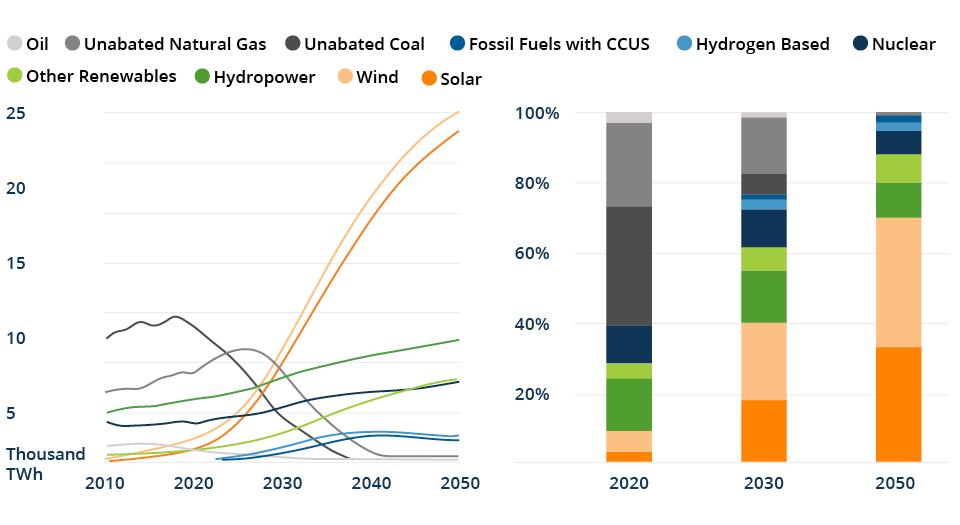
By 2050, almost 90% of electricity generation will need to come from clean sources—with wind and solar together accounting for nearly 70% (see Figure 2).5 This means that, along the IEA’s net-zero pathway, wind capacity needs to increase by 11x, while solar needs to rise by 20x.

Figure 2: The Leap to Clean Energy

Global Electricity Generation by Source in the Net-Zero Emissions by 2050 Scenario

The Leap to Clean Energy
Source: International Energy Agency (IEA). CCUS—carbon capture, utilization and storage. TWh—terawatt-hour.

Fortunately, wind and solar are already cost-effective and economical to deploy. In fact, they are now the cheapest sources of new bulk power generation for 90% of the world’s electricity demand, according to BloombergNEF’s levelized cost of energy analysis. And it’s less costly to build and operate new large-scale wind or solar plants than it is to run existing coal or gas-fired power plants in nearly half the world.6 We expect that trend to accelerate with continued economies of scale in renewable equipment production.

Another positive development on the path to net zero is that priorities are changing among governments and companies alike. Net-zero pledges today cover around 70% of global carbon7  emissions—and over 70% of global GDP (see Figure 3).

Figure 3: Momentum Behind Decarbonization Has Never Been Stronger

Global GDP Covered by Net-Zero Pledges

Momentum Behind Decarbonization Has Never Been Stronger
Source: World Bank, ECIU, Bernstein analysis.

Countries are turning Paris Agreement targets into credible climate policies and legislated objectives. These could be in the form of clean electricity standards, the implementation of carbon pricing, or government spending toward building electric vehicle charging stations and a more resilient grid. For example, U.S. President Joe Biden plans to enact legislation that would mandate that 80% of U.S. electricity generation come from clean energy sources by 2030—and 100% by 2035.8 Meanwhile, Canada recently passed legislation that enshrines climate targets into law.9

These pledges are cascading down from the country level to the company level—and that is the opportunity. Companies will need to work with partners that have substantial operating expertise, as well as large-scale capital, to implement these decarbonization plans—and demonstrate that they are, in fact, transitioning to net zero. As a first step in reducing emissions, companies will look to enter into contracts with renewable energy suppliers. Actions could also include acquiring onsite or offsite renewable power, electrifying industrial processes, and implementing green hydrogen and battery storage.

The greening of global power grids is the single largest decarbonization opportunity around the world today, and we must take action right now.

Corporate Power Contracts

A growing number of companies are voluntarily setting targets for carbon reduction as a way to address climate change, differentiating their businesses and bolstering their reputations. 

Looking ahead, the likely combination of increased regulations, carbon taxes and stakeholder pressures will only emphasize the need for businesses to decarbonize the production process of whatever goods or services they provide. 

The first step in every decarbonization plan is simply greening the power used in one’s business. This immediately addresses Scope 2 emissions, which are the indirect emissions from the generation of purchased energy. 

As companies implement these goals, they will need to source clean energy, often through power purchase agreement (PPA) contracts with renewable energy suppliers (see Figure 4). These PPAs offer the developers of renewable projects a mechanism to lock in power prices for around 10–20 years, providing the revenue certainty to build out new projects and generate a return on their capital. Furthermore, because the PPA structures are tied to new renewable generating facilities, these deals often generate additionality—meaning the investment increases the quantity or quality of renewable energy output beyond what would have otherwise occurred. 

Figure 4: Corporate PPA Activity Is High for U.S. Solar

Volumes by Region (GW)

Corporate PPA Activity Is High for U.S. Solar

Volumes by Technology (GW)

Corporate PPA Activity Is High for U.S. Solar
Source: Bloomberg New Energy Finance (2021), Corporate PPA database, IEA. GW—gigawatts.

Amazon, for example, is the largest corporate buyer of renewable energy in the world and is making progress toward its goal of 100% renewable energy by 2025. In June 2021, Amazon announced that it had reached 10 gigawatts (GW) of renewable energy capacity; it now has 232 renewable energy projects globally, including 85 utility-scale wind and solar projects and 147 solar rooftops on facilities and stores worldwide.10 These projects will supply renewable energy to Amazon’s corporate offices, fulfillment centers, data centers and Whole Foods stores.

Facebook is another large buyer of renewable energy. As of last year, its operations are supported by 100% renewable energy. The company has contracts in place for more than 6 GW of wind and solar energy across 18 states and five countries. All 63 of its projects are new and located on the same electrical grids as the data centers they support.11

It’s not only technology companies sourcing clean energy. Other sectors, like chemicals, are also participating. BASF, for example, recently acquired an interest in an offshore wind farm being developed in the Netherlands. Once operational, BASF will acquire electricity from its ownership share of the wind farm through a long-term PPA.12 Given BASF’s target of achieving net-zero emissions by 2050, one important lever in bringing down its Scope 2 emissions is replacing fossil-based electricity with fossil-free electricity.

To satisfy this increasing demand in corporate contracting, renewable energy partners must be able to secure, build out and consistently replenish a new development pipeline. This entails working on the ground to secure land, often from multiple landowners, as well as grid connection and permits. As projects advance, equipment procurement, engineering and development, and construction management skills are also required. Capital is a prerequisite, but opportunities to help companies reach their green power objectives increasingly favor partners with development and commercial capabilities, who can tap into the growth of the corporate PPA market.

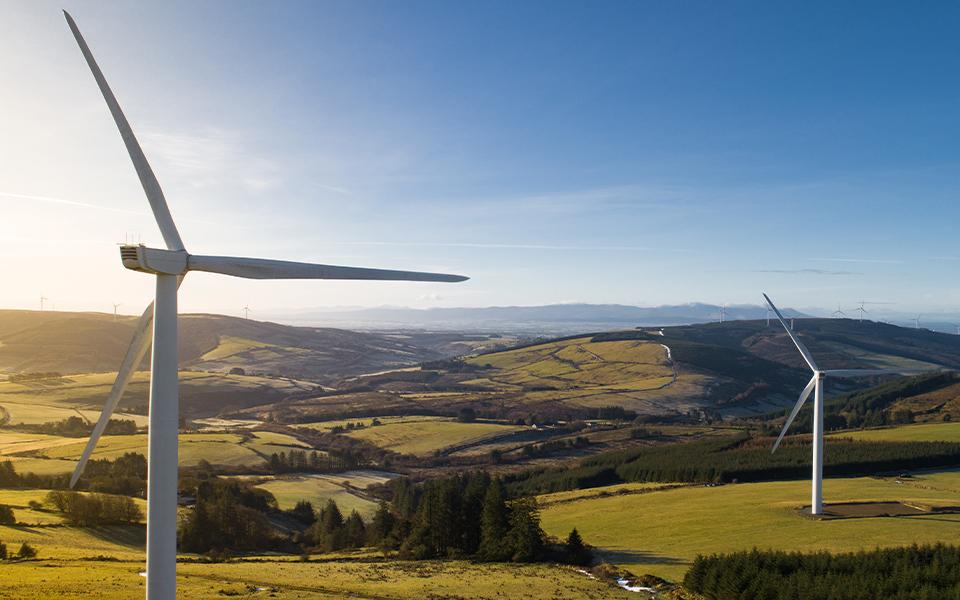
Brookfield Wind Turbines

Solar and Wind

In 2020, despite the economic slowdown that resulted from the Covid-19 pandemic, renewables capacity grew 10%. Out of all new electricity capacity added last year, 80% was renewable, with solar and wind accounting for 91% of that share.13

Demand from corporate off-takers, favorable economics and the regulatory push for the power generation sector to green-up to meet national carbon reduction targets are all contributing to the growth in development of clean energy. 

By the end of this year, renewables are expected to represent 30% of electricity generation worldwide, providing a significant runway for growth.14 Low-carbon sources of generation, including nuclear, exceeded output from the world’s coal plants for the first time in 2020 (see Figure 5). 

Figure 5: Solar and Wind Grow While Coal Declines

Share of Low-Carbon Sources and Coal in World Electricity Generation, 1971–2021

Solar and Wind Grow While Coal Declines
Source: International Energy Agency (IEA).

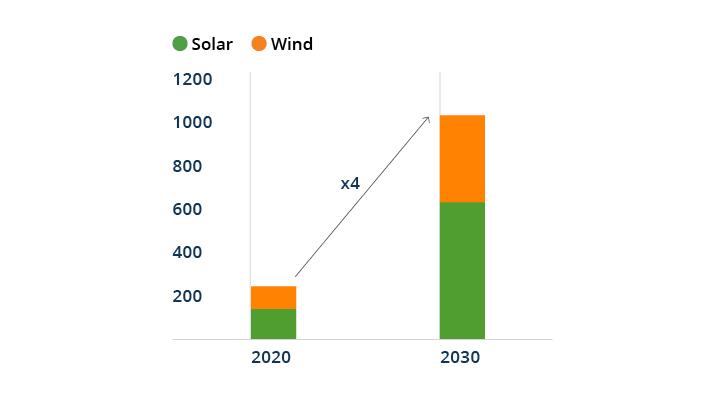
Renewables are growing, but they need to grow even faster. Solar and wind power need to reach annual additions of 630 GW of solar and 390 GW of wind, according to the IEA (see Figure 6). In other words, by 2030, renewables development needs to be 4x what it was in 2020—a record year.15

Figure 6: Renewable Energy Technologies Need to Quadruple by 2030

Capacity Additions (GW)

Figure 6: Renewable Energy Technologies Need to Quadruple by 2030
Source: International Energy Agency (IEA). GW—gigawatts.

The Biden administration’s bipartisan infrastructure deal provides an example of governments acknowledging the need to accelerate renewables development. While the deal contains few of the ambitious ideas that Biden initially proposed, it does contain $550 billion of new spending. Specifically, it allocates $73 billion to upgrade U.S. power infrastructure; this amount includes the buildout of new transmission lines to facilitate the expansion of renewable energy.16 Tax support for clean energy generation can assist as well. In fact, Biden’s American Jobs Plan proposes the long-term extension of clean energy tax credits.17

Currently, solar (utility and distributed generation) and wind (onshore and offshore) are the actionable technologies that companies can help develop to address their Scope 2 emissions. This is because solar and wind are economic and well advanced technologically. There is also a need—and opportunity—for investment in emerging renewable technologies in order to get to net zero.

Almost half the reductions in the IEA’s net-zero pathway by 2050 come from technologies that are currently in the demonstration or prototype phase. These include batteries and green hydrogen.

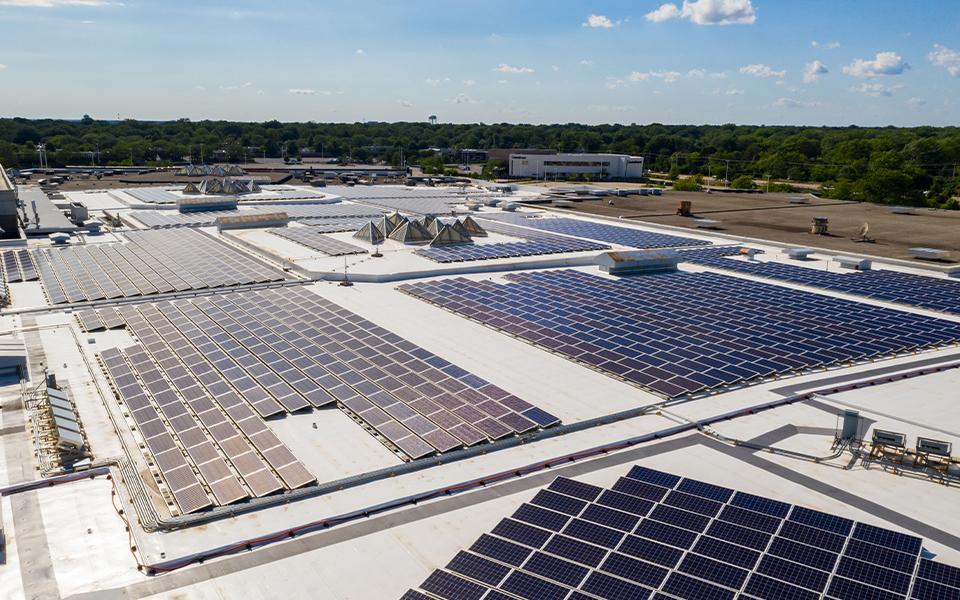
Solar distributed generation

Distributed generation (DG) leverages the places where we live and work, which hold a significant amount of energy-making capability.

Advancements in solar panels not only mean that we can easily install them on our rooftops, but that they can be integrated into and around a building—including on windows, awnings and parking spaces. 

Distributed generation describes the generation of electricity for use onsite, rather than the transmission of energy over the electric grid from a large, centralized facility. Demand for onsite generation continues to grow as the decarbonization ambitions of commercial and industrial clients have accelerated. By providing direct access to onsite renewable power, distributed generation can help customers, whether they are municipalities, schools or companies, reduce their carbon emissions.

By 2027, the global distributed generation market is expected to reach $440 billion

Distributed generation allows a customer to generate their own electricity, and purchase electricity from a traditional utility as needed. In some cases, the customer might only need the utility as a backup—for instance, if the customer has access to a battery and has reduced their load through energy efficiency initiatives.

Additionally, in most markets, distributed generation is one of the most economic sources of bulk power today, making it attractive for both energy suppliers and procurers. This is particularly beneficial to self-consumers, where production does not include the cost of power transmission.

Thus, distributed generation can help customers not only offset their energy needs, but be greener as well. It’s at the forefront of the energy transition because it allows customers who want to be part of the green economy to have access to it. 

Distributed Generation

BloombergNEF forecasts that the amount of commercial and industrial distributed generation that will be added in the next five years is almost double the amount from the previous five years. And the market research company Global Industry Analysts projects that the global DG market will reach $440 billion by 2027.18

Consequently, both the electricity grid and the ways customers use electricity will evolve. The system will gradually move away from big central fossil fuel generating stations to both large- and small-scale renewable generation. Generating power closer to the load avoids transmission and distribution losses and, when paired with battery storage, provides energy resilience.

Wind

New design and advanced manufacturing technology are improving the economics of clean energy projects. Within solar, for example, efforts to boost power generation per panel mean developers can deliver the same amount of electricity from a smaller and less expensive operation.19

While advancements have made solar panels smaller, they’ve had the opposite effect for wind turbines. Here, manufacturers are incorporating stronger materials into their design, thus allowing their turbines to reach unprecedented sizes. The result is the ability to generate much more electricity—and revenue—per turbine (see Figure 7).

Figure 7: Wind Turbines Have Grown Bigger and More Efficient

Offshore Wind Turbines Have Grown Bigger and More Efficient
Source: Company materials, Brookfield Public Securities. Turbine images scaled by approximate height. MW—megawatts.

Wind repowering provides another opportunity. Wind repowering is the combined activity of dismantling or refurbishing existing wind turbines and commissioning new ones.20 The market for repowerings is large: Within the next five years, almost 200 GW of global wind capacity will be at least 15 years old. With repowerings, turbine hardware can be replaced with more efficient versions while keeping the rest of the infrastructure unchanged, thereby increasing facility production.

We see significant runway ahead for this industry to further scale. The Biden administration, for example, is looking to jumpstart offshore wind energy. Offshore wind power has been led by Europe, which has already installed 25 GW of capacity (see Figure 8).21 But in March, the Biden administration set a target of 30 GW of offshore wind by 2030, up from a meager 42 megawatts now. Additionally, in May, the White House approved the Vineyard Wind project, the first commercial-scale offshore wind farm in the U.S.22

Figure 8: Europe Leads in Offshore Wind Power

Generating Capacity (GW)

Europe Leads in Offshore Wind Power
Source: International Renewable Energy Agency, Wood Mackenzie, Financial Times. GW—gigawatts. MW—megawatts.

Storage

Wind and solar power are intermittent; therefore, as more industries become electrified, storage will play an essential role in the development of renewables and will be another investment opportunity going forward.  

Electricity grids always need to be balanced between supply and demand. But this is increasingly difficult as power generation stacks move away from more carbon-intensive baseload thermal production, like coal and natural gas, to intermittent renewable power. This creates a need for increased storage to accompany and facilitate increased renewables penetration. 

Battery storage technology needs to advance to allow renewables to meet full-scale demand peaks, shift energy across time and provide critical grid-stabilizing and ancillary services. Yet the development of battery storage has mainly focused on the electrification of transportation, not necessarily the electrical grid. While electric vehicles make up only 1% of the total U.S. vehicles on the road today, Goldman Sachs forecasts electric vehicles to comprise 13% of the automotive fleet by 2030—and 32% by 2040 (see Figure 9). As the auto sector drives improvements in battery technology, the power sector should be able to take advantage. 

Figure 9: Expect Battery Technology Improvements From the Auto Sector

Total Cars on the Road in the U.S.

Expect Battery Technology Improvements From the Auto Sector
Source: Goldman Sachs Global Investment Research.

In the interim, as more renewables come onto the grid, it highlights why improvements in battery storage are necessary. In August 2020, when extreme heat and wildfires led to power outages in California, a two- or four-hour battery was sufficient, as rolling blackouts soon ended and power came back online. But when longer outages occur, it becomes apparent that further emergence of long-duration energy storage, such as the iron-air battery, will be critical to the renewable energy value chain or simply to address overnight periods where the sun does not shine.

Battery technology will improve—and the global energy storage market will grow—with help from both governments and investors. It might come in the form of a standalone tax credit for energy storage. It could also come from the demand side. Investment in storage solutions could allow industrial consumers, or other large electricity users, to reduce their energy consumption needs from the grid during periods of peak power demand.  Approximately $5.4 billion of new investment was committed to storage projects across the world last year, increasing the total cumulative investment to an estimated $22 billion.23 More investment is planned; by 2025, Wood Mackenzie forecasts the overall investment size will reach $86 billion.

The global energy storage market exceeded 15 GW/27 GWh (gigawatt-hours) in 2020. By adding 70 GWh of storage capacity per year, the market is expected to grow 27 times by 2030, such that it should surpass 729 GWh in 2030.24 Most of this growth will come from the U.S. and China.

In the U.S., the trend of significant growth in large-scale battery capacity shows no sign of abating. Project developers plan to install more than 10 GW of large-scale battery storage capacity in the U.S. between 2021 and 2023, 10 times the storage capacity available in 2019, according to an August report from the U.S. Energy Information Administration (EIA).25

By 2030, the global energy storage market is expected to grow 27x

In California, where solar currently makes up over 26% of the state’s electricity mix, large technology companies are now incorporating energy storage into their plans.26 Amazon, in April, announced its first solar project paired with energy storage in the state.27 Apple, meanwhile, announced it was constructing California Flats, one of the largest battery projects in the U.S.28 

On the whole, storage is not commercially cost-effective in most markets around the world today, but it is well on its way to get there. It will also become more commercially viable in a growing number of situations. Economies of scale in the sector, the global buildout of renewables, and technology improvements will all help.29 Federal regulation, as well as state and local mandates that address climate change, will further expedite this process. 

Since 2010, small developments have had the cumulative effect of cutting the cost of lithium-ion batteries by over 85% (see Figure 10).30 Specifically, big increases in manufacturing capacity lowered costs while tweaks to chemistry and design yielded further savings.31

Figure 10: Battery Prices Have Dropped Sharply

U.S. Dollars per Kilowatt-Hour per Ton

Battery Prices Have Dropped Sharply
Source: BloombergNEF.

Over the past decade, the cost of lithium-ion batteries fell by over 85%

In some markets, renewables combined with batteries are slowly becoming cost-competitive with gas-fired power plants. For example, in the U.S., the cost of discharging a 100-megawatt battery with a two-hour power supply can be achieved for as little as $140 per megawatt-hour.32 This compares favorably to a “peaker” gas plant, which fires up on demand when supplies are scarce. A peaker plant can generate power for as low as $151 per megawatt-hour. Meanwhile, solar farms paired with batteries are narrowing the cost gap with gas plants that can run all the time.

We expect battery prices to continue heading lower. In fact, over the next decade, BloombergNEF projects the cost of lithium-ion battery pack prices to decline by half.33 As costs fall, renewables plus storage will provide a cleaner and cheaper form of energy than fossil fuel generation in more regions around the world.

Battery Prices Have Dropped Sharply

Green Hydrogen

Hydrogen allows the storage and transport of energy in a usable form from one place to another.34 When it releases energy, it does not emit carbon. Because hydrogen has a high energy content per unit of weight, it can be used in a wide range of industrial applications. 

Hydrogen is also the most abundant element in the world, yet it represents a small fraction of the global energy mix today. That’s because hydrogen is not readily available in pure form—releasing hydrogen requires an initial energy source and a technical application—and most of the hydrogen today is produced using natural gas.

Hydrogen produced with clean sources of power (often referred to as “green hydrogen”) could be a game changer. This is because green hydrogen can help decarbonize hard-to-abate emissions coming from high-polluting heavy-duty and industrial sectors, like long-haul transport and steel production.

Green hydrogen uses renewable energy to power an electrolyzer that splits water into hydrogen and oxygen; as a result, it is a clean source of power. Said differently, if the electricity used is clean, then it means producing and using hydrogen is a low-carbon process.

Stabilization benefits are another attractive feature of hydrogen; this allows for the creation and storage of a transportable energy source when wind or solar produce excess energy. This storable quality creates huge benefits in balancing the grid. The dynamic here will create further demand for renewables, which can then support green hydrogen production.

Hydrogen demand is projected to grow by 7x on the path to net zero by 2050 (see Figure 11). However, the technology and infrastructure necessary to support the development of green hydrogen remain in their infancy today, and the capital expenditure requirements are significant. Note that certain forms of existing infrastructure will need to be repurposed for hydrogen. Additionally, producing green hydrogen depends on having lots of renewable energy supply—another reason for the development of more renewables. When Naturgy, a Spanish gas utility, presented its five-year strategic plan for the energy transition, it addressed these ideas. Announced in July, Naturgy plans to invest €14 billion by 2025—with most of the capex allocated to boosting renewable generation capacity and adapting its networks.35

Figure 11: Hydrogen Demand to Increase 7x on the Path to Net Zero

Global Clean Hydrogen Addressable Market for Net Zero by 2050 (Millions of Tonnes per Year)

Hydrogen Demand to Increase 7x on the Path to Net Zero
Source: Goldman Sachs Global Investment Research.

Green hydrogen today cannot compete on cost with alternatives like natural gas, fossil-fuel-derived gray hydrogen, or even blue hydrogen, which has most of the CO2 emitted during its production captured or stored. To achieve this, the industry needs to scale, which will help bring costs down to reach parity with other fuels.

Policy support, of course, will help the industry scale faster and lower production costs. Fortunately, this support is starting. For example, the European Commission’s hydrogen strategy, launched in 2020, involves an estimated investment of €470 billion by 2050.36 Against the current European electrolyzer installed base of 0.1 GW, the strategy aims to install 6 GW of green hydrogen electrolyzers by 2024, rising to at least 40 GW by 2030.37

European infrastructure for hydrogen is mobilizing as well. The European Hydrogen Backbone (EHB) initiative, a group of 23 natural gas systems operators from 21 countries, has proposed to build a 39,700-kilometer hydrogen grid by 2040.38 The EHB was formed with the aim of better facilitating and planning hydrogen transportation infrastructure across the continent. According to the EHB, some 69% of the proposed hydrogen network consists of repurposed existing natural gas grids; the remaining 31% would require new pipeline construction.

131 large-scale hydrogen projects have been added since February 2021

The EHB’s projected price tag of €43-81 billion might even be feasible, considering the amount of dedicated green hydrogen funding within the EU Green Deal. For context, by 2050, Europe aims to become the world’s first climate-neutral continent.39 Goldman Sachs estimates the EU Green Deal will total €10 trillion by then (see Figure 12). This is a plan estimate—a combination of clean energy investments, energy efficiency investments and subsidies, such as to help facilitate the move toward electric vehicles. Of this total amount, clean energy investments could total €7 trillion. Also note that the legislative roadmap for Europe’s net-zero plan is already being laid out; the EU’s “Fit for 55” initiative outlines measures to reach at least a 55% reduction in emissions by 2030, versus 1990 levels—and is particularly supportive for renewable power generation.

Figure 12: A €10 Trillion Estimate for the EU Green Deal

2050

A €10 Trillion Estimate for the EU Green Deal
Source: Goldman Sachs Global Investment Research.

As investment leads to the ramp-up of hydrogen capacity, costs will become more competitive. Globally, according to the Hydrogen Council, 131 large-scale projects have been announced since February 2021—taking the total to 359 projects.40 These include gigascale production projects, large-scale industrial usage projects and transport projects. Europe remains the center of hydrogen development, but China is emerging as a powerhouse as well.

When green hydrogen experiences cost declines similar to those seen in wind and solar, it will be a major positive for the transition to net zero. To demonstrate, blue hydrogen production facilities are at a cost advantage over green hydrogen today. However, over the next decade, that dynamic is expected to reverse. By 2030, BloombergNEF forecasts green hydrogen to be cheaper than blue hydrogen in all modeled countries; this includes those with cheap gas, such as the U.S., and those with pricey renewable power, such as Japan and South Korea.41

In January, Nel ASA, a Norwegian electrolyzer producer, outlined a target of producing green hydrogen at $1.50/kg by 2025, which would make it competitive with fossil alternatives.42 Meanwhile, in June, the U.S. Department of Energy launched an initiative to lower the cost of green hydrogen to $1/kg within the decade.43 As green hydrogen production costs are roughly $5/kg today, successful outcomes here would be a promising development.44

Conclusion

Net zero by 2050, according to the IEA’s roadmap, hinges on a significant leap toward clean energy in this decade. But the path to net-zero emissions is narrow—and staying on it requires immediate and massive deployment of all available clean energy technologies.

Going forward, the electricity grid will evolve. It will need to support mass adoption of electric vehicles, distributed energy resources, like rooftop solar, and more large-scale wind, solar and storage resources.45 And as renewables gain more market penetration, they will be able to power the production of green hydrogen as well.

Yet, during this time, the one constant will be that companies will need to decarbonize. Procurement of clean energy leads to the avoidance of carbon emissions—and demonstrates to their various stakeholders that they are on the right path.

Endnotes:

1. IPCC Interactive Atlas. 
2. World Resources Institute, Interactive Chart; data from Climate Watch. 
3. U.S. Department of Energy’s National Renewable Energy Laboratory, Electrification Futures Study, July 2018. 
4. IEA, “Pathway to critical and formidable goal of net-zero emissions by 2050 is narrow but brings huge benefits,” May 2021. 
5. IEA, “Net Zero by 2050,” May 2021. 
6. Bloomberg, Building New Renewables Is Cheaper Than Burning Fossil Fuels, June 23, 2021. 
7. References to “carbon” are generally being used in place of “carbon dioxide equivalent” (CO2e), which includes other greenhouse gases such as methane, nitrous oxide, etc. 
8. Financial Times, “Biden plans push to enact clean electricity standard,” June 30, 2021.
9. Toronto Star, “How Bill C-12 aims to guide Canada to net zero,” June 30, 2021. 
10. Amazon, “Amazon Becomes Largest Corporate Buyer of Renewable Energy in the U.S.,” June 23, 2021. 
11. Facebook, “Achieving our goal: 100% renewable energy for our global operations,” April 15, 2021. 
12. BASF, “Vattenfall to sell 49.5% of the offshore wind farm Hollandse Kust Zuid to BASF,” June 24, 2021. 
13. International Renewable Energy Agency, “World Adds Record New Renewable Energy Capacity in 2020,” April 5, 2021. 
14. IEA, “Global carbon dioxide emissions are set for their second-biggest increase in history,” April 20, 2021.
15. IEA, “Pathway to critical and formidable goal of net-zero emissions by 2050 is narrow but brings huge benefits,” May 18, 2021.
16. The White House, “FACT SHEET: Historic Bipartisan Infrastructure Deal,” July 28, 2021. 
17. The White House, “FACT SHEET: The American Jobs Plan,” March 3, 2021.
18. Global Industry Analysts, Distributed Generation (DG) Global Market Trajectory & Analytics, August 2021
19. Bloomberg, “Solar is Dirt-Cheap and About to Get Even More Powerful,” July 6, 2021.
20. U.S. Energy Department, “Wind Repowering Helps Set the Stage for Energy Transition,” June 2, 2021. 
21. Financial Times, “US offshore wind projects test strength of Joe Biden’s green jobs promise,” May 12, 2021.
22. New York Times, “Biden Administration Approves Nation’s First Major Offshore Wind Farm,” May 12, 2021.
23. Wood Mackenzie, “Americas to lead global energy storage market by 2025,” April 20, 2021.  
24. Wood Mackenzie, “Americas to lead global energy storage market by 2025,” April 20, 2021. 
25. U.S. Energy Information Administration, “U.S. large-scale battery storage power capacity increased 35% in 2020,” Aug. 16, 2021.
26. Bloomberg, “California’s Solar Industry Is Getting Sunburned,” March 11, 2021. 
27. Amazon, “Amazon Becomes Europe’s Largest Corporate Buyer of Renewable Energy," April 19, 2021.
28. Apple, “Apple powers ahead in new renewable energy solutions with over 110 suppliers,” March 31, 2021.
29. Wall Street Journal, “Startup Claims Breakthrough in Long-Duration Batteries,” July 22, 2021.
30. Bloomberg, “The Hidden Science Making Batteries Better, Cheaper and Everywhere,” April 27, 2021.
31. Wall Street Journal, “The Battery Is Ready to Power the World,” Feb. 5, 2021.
32. Wall Street Journal, “Natural Gas, America’s No. 1 Power Source, Already Has a New Challenger: Batteries,” May 16, 2021.
33. Bloomberg, “The Hidden Science Making Batteries Better, Cheaper and Everywhere,” April 27, 2021.
34. U.S. Energy Information Administration, “Hydrogen explained,” Jan. 7, 2021. 
35. Naturgy, “Naturgy presents its strategic plan for the period to 2025 with investments of 14 billion to strengthen its role in the energy transition,” July 28, 2021. 
36. European Commission, “A hydrogen strategy for a climate-neutral Europe,” July 8, 2021. 
37. European Commisison, “In focus: Hydrogen – driving the green revolution,” April 14, 2021. 
38. Gas for Climate, “European Hydrogen Backbone grows to 40,000 km, covering 11 new countries,”, April 13, 2021.
39. European Commission website, “EU climate action and the European Green Deal.”
40. Hydrogen Council, “Hydrogen Investment Pipeline Grows to $500 Billion in Response to Government Commitments to Deep Decarbonization,” July 2021. 
41. BloombergNEF, “Green Hydrogen to Outcompete Blue Everywhere by 2030,” May 5, 2021.
42. Nel, “Nel CMD 2021: Launches 1.5 USD/kg target for green renewable hydrogen to outcompete fossil alternatives,” Jan. 21, 2021. 
43. U.S. Dept. of Energy, “Secretary Granholm Launches Hydrogen Energy Earthshot to Accelerate Breakthroughs Toward a Net-Zero Economy,” June 7, 2021. 
44. Standard & Poor’s, “Experts explain why green hydrogen costs have fallen and will keep falling,” March 5, 2021. 
45. Wall Street Journal, “We Need a Better Grid and Better Policies,” March 4, 2021.

Disclosures

This commentary and the information contained herein are for educational and informational purposes only and do not constitute, and should not be construed as, an offer to sell, or a solicitation of an offer to buy, any securities or related financial instruments. This commentary discusses broad market, industry or sector trends, or other general economic or market conditions and is being provided on a confidential basis. It is not intended to provide an overview of the terms applicable to any products sponsored by Brookfield Asset Management Inc. and its affiliates (together, "Brookfield"). 

This commentary contains information and views as of the date indicated and such information and views are subject to change without notice. Certain of the information provided herein has been prepared based on Brookfield's internal research and certain information is based on various assumptions made by Brookfield, any of which may prove to be incorrect. Brookfield may have not verified (and disclaims any obligation to verify) the accuracy or completeness of any information included herein including information that has been provided by third parties and you cannot rely on Brookfield as having verified such information. The information provided herein reflects Brookfield's perspectives and beliefs. 

Investors should consult with their advisors prior to making an investment in any fund or program, including a Brookfield-sponsored fund or program.